A multimodal MRI model has correlated brain imaging data linking rheumatoid arthritis (RA) and brain changes associated with depressive disorders (DD), according to a poster to be presented May 11 at the ISMRM meeting in Cape Town, South Africa.
The study of RA patients explored the connections between brain function, depressive symptom severity, and clinical indicators of RA, where neuroimaging data has previously fallen short, wrote a group led by Yuling Wang, PhD, of the Suzhou High-tech Zone People’s Hospital in Suzhou, China.
"To date, brain function research on RA patients with DD is limited," the group wrote. "This research contributes to early diagnosis and prognosis assessment of depressive disorders in rheumatoid arthritis patients by clarifying neural mechanisms, providing imaging-based evidence for clinical decision-making and future intervention studies."
To bridge the gaps, Wang and colleagues integrated imaging data obtained from 3D-T1 weighted imaging (T1WI), arterial spin labeling (ASL), resting-state functional MRI (fMRI), and MR spectroscopy (MEGA-PRESS) measurements of glutamate and gamma-aminobutyric acid (GABA) to compare gray matter structure, cerebral blood flow, brain functional networks, and metabolism.
The study included 27 female patients with RA (with and without depressive disorders), and 15 female healthy controls. Participants underwent psychological and cognitive assessments. The model also incorporated clinical data including rheumatoid factor (RF), C-reactive protein (CRP), and erythrocyte sedimentation rate (ESR), according to the group.
Upon analysis of the MR images and measurements, Wang and colleagues found that RA patients with depressive disorders exhibit preserved gray matter volume. There were no differences in gray matter volume among the three groups, they found.
The group also found the following:
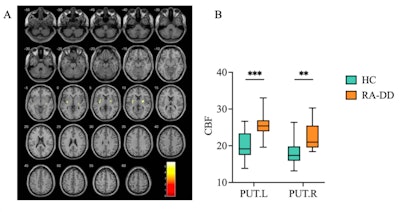
 Figure A shows a statistical parametric map highlighting brain regions with significantly different cerebral blood flow (CBF) of rheumatoid arthritis patients with depressive disorder compared to healthy controls. Figure B shows the box plot comparing the mean CBF values extracted from the significant clusters identified in Figure A.ISMRM"Network analysis showed that all groups had small-world properties with no global index differences, but altered local indices (e.g., reduced DC in the right parahippocampal gyrus) in RA groups," the group noted.
The work enhances understanding of the mechanisms behind depressive disorders in RA, the group said.
Whether you are a professional looking for a new job or a representative of an organization who needs workforce solutions - we are here to help.